Figures
The most common types of figures used in biology are plots (sometimes called ‘graphs’) which take many forms such as scatter plots and bar charts. However, biological illustrations, maps, and diagrams are also considered figures and must be formatted in the same way. Avoid pie charts at all costs.
Figure Formatting
- Figures can be placed in-line with the rest of the document (to save paper), but it is much easier to format a document if the figures and tables are at the end.
- Biological illustrations are just other figures, but are typically drawn, then scanned.
- Size of figures on the page will depend on the content, but must be large enough for labels, data, and trends to be evident. A biological illustration, for example, should be large enough to represent clearly all the details without crowding.
- Use large fonts or write labels (for illustrations) so everything can be read clearly.
- All figures must be referred to in the text of the results section [e.g. “Plant growth increases as light levels increase (Figure 1)]”.
- There is no need to put values above the bars or dots on a figure.
- Error bars are encouraged (either standard deviation or standard error).
- It the x-axis is composed of categories, then label them correctly (see Figure 4 below where the categories are 'golden-mantled' and 'thirteen-lined').
- Colours are discouraged unless absolutely necessary, and if used, should be consistent across figures. Patterns are often more visible and more acceptable for scientific publication.
Figure Captions
Figure information is normally placed below a figure and is referred to as the “caption”, with specifications as follows:
- each figure is sequentially numbered and “Figure” is written out in full to start the caption e.g. “Figure 2. Production of C02 in leaves ...”
- the caption should include enough information to be interpreted without reading the text of the report (a proper caption allows you to display your work elsewhere, e.g. a poster or presentation)
- the information contained within the caption should include the variable being measured, how the variable is measured if the means of measurement are indirect, the subject of the measurement, and the conditions under which the measurements were taken (see examples)
- do not simply repeat the axis labels (e.g., ‘Height versus fertilizer concentration’)
- notes can go within the caption as separate clauses
- the caption should never begin with the words “Graph of…” or “Figure of…”
Example (text, figure, and caption)
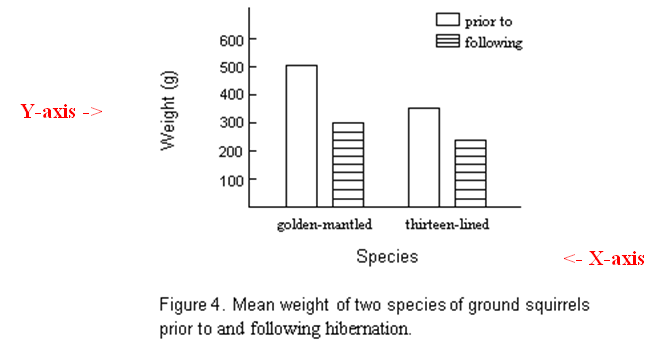
Mean weight of golden-mantled ground squirrels was 150 g greater than that of thirteen-lined ground squirrels prior to hibernation. Although both species lost weight during hibernation, golden-mantled ground squirrels exhibited greater weight loss (Figure 4).
In the above example, only the major observations and/or key trends are pointed out; there is no attempt to explain why golden-mantled ground squirrels are heavier prior to hibernation or why both species lose weight during hibernation.